Beef, Poultry & Pork Market Update
7/1/26
Highlights
Beef
The beef complex was generally steady to firm this week despite ongoing tight fed cattle supplies and lighter harvest levels. Rib and loin items were mostly steady to slightly higher, reflecting continued foodservice demand heading into the holiday period. Chuck items were mixed, with clod products softer while chuck rolls held steady. Round cuts remained mostly steady to slightly higher, while briskets continued to improve. Ground beef markets strengthened as lean trim availability remained supportive of grinding demand.
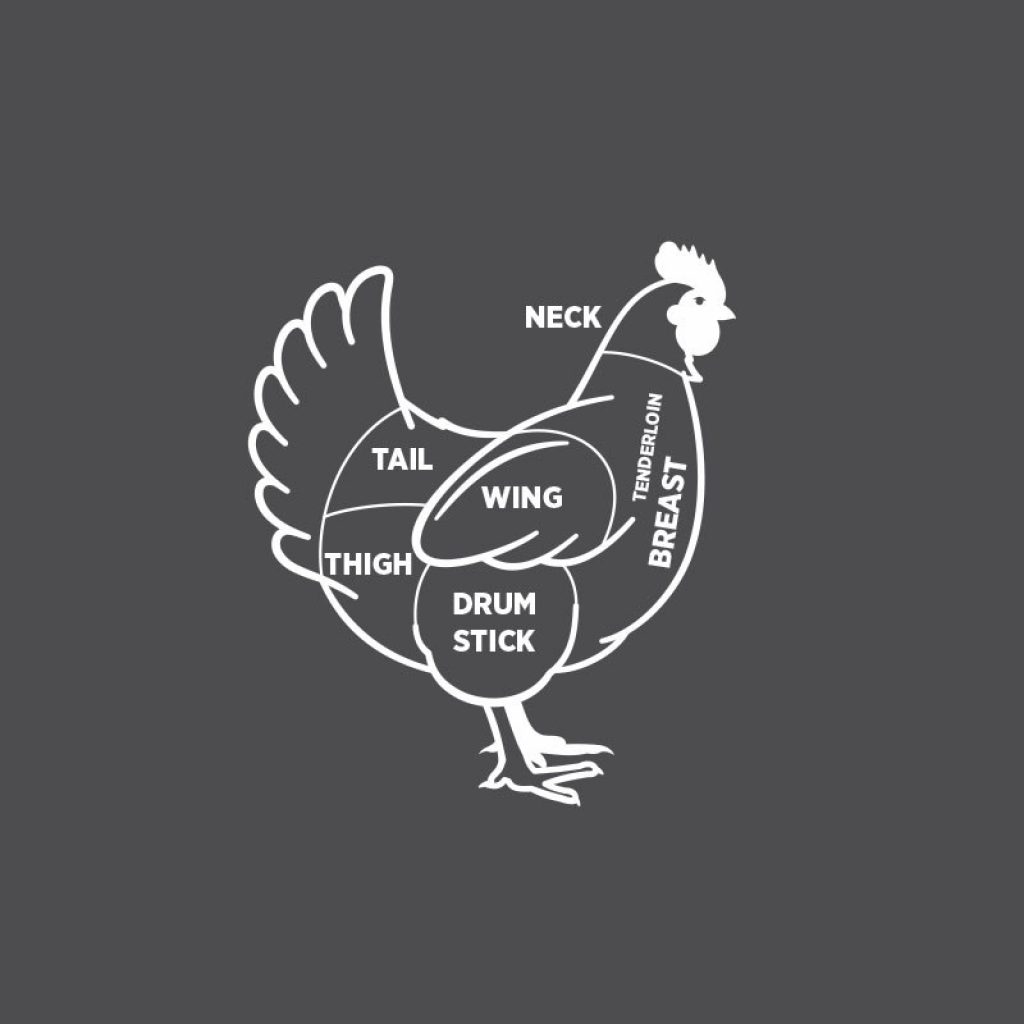
Poultry
Chicken markets remain split as the industry continues to see a feast-or-famine environment heading into the Fourth of July holiday. Wings remain the strongest segment of the complex with tight spot availability supporting values, while tenders and thigh meat continue to face pressure from ample supplies. Breast meat and whole birds are holding steady, and leg quarters, drumsticks, and bone-in thighs remain balanced as holiday demand approaches.
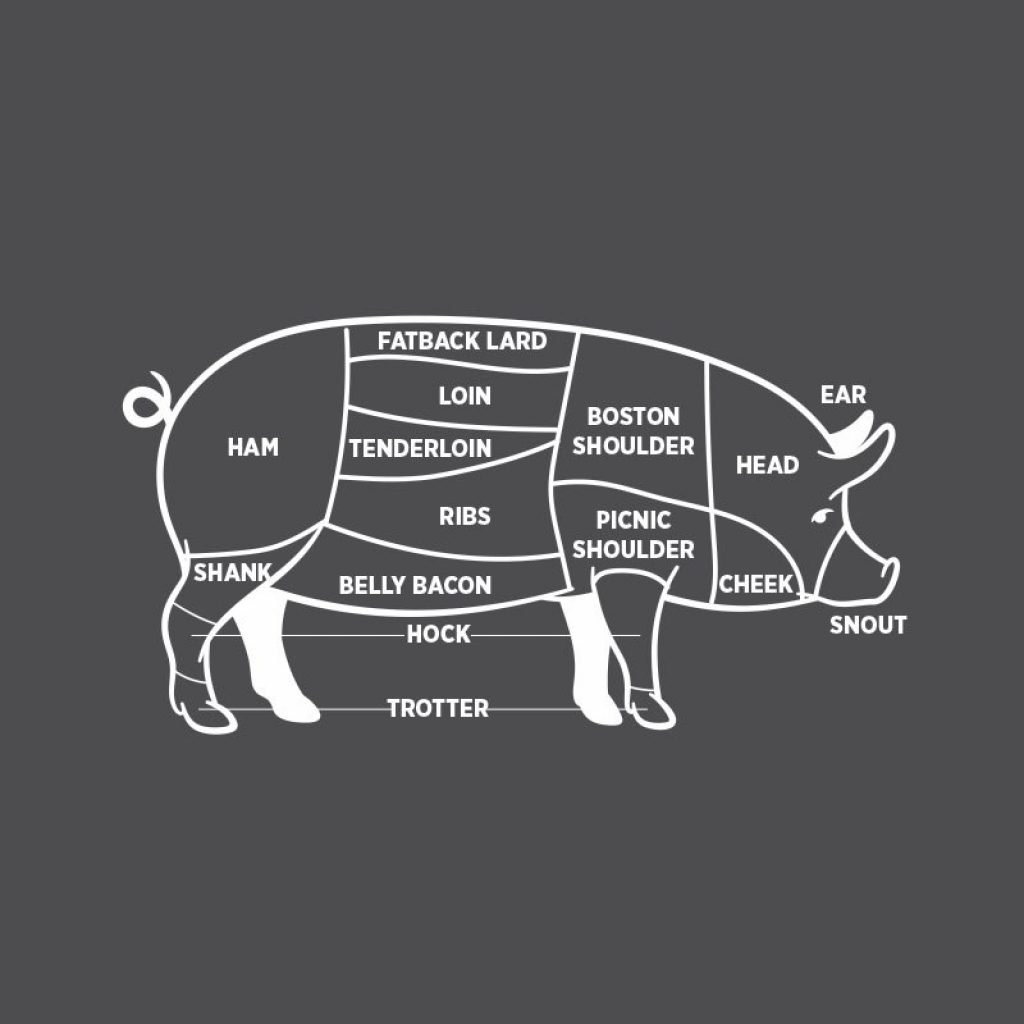
Pork
Pork markets softened this week as the belly complex experienced a sharp correction following several weeks of gains. The overall pork cutout drifted lower, while hog supplies remain adequate and slaughter levels continue at seasonal rates. Demand remains steady, but softer export activity and pressure on packer margins created a more cautious tone across the complex. Most primal values remain balanced, with bellies seeing the most volatility.
Bacon
Belly markets moved sharply lower this week following an abrupt midweek selloff that erased much of the recent rally. Bacon pricing reflected the softer belly market, ending a multi-week run of increases. Near-term market expectations call for steady to lower belly values over the next one to two weeks before seasonal demand begins providing support later in July. Supplies remain manageable, but demand signals have become more cautious in the short term.
Chicken
Whole Birds (WOGs) – Steady
Boneless / Skinless Breasts – Steady
Tenders – Down
Whole Wings – Up
Drumsticks – Steady
Leg Quarters – Steady
Bone In Thighs – Steady
Boneless / Skinless Thighs – Down
Pork
Bellies – Down
Spareribs – Steady
Hams – Down
Loins – Steady
Back Ribs – Steady
Tenderloins – Steady
Butts – Down
Picnic – Steady
Cushion – Steady
Fat Trim – Steady
Lean Trim – Up
Beef subprimals USDA Choice for delivery week of 7/6/26.
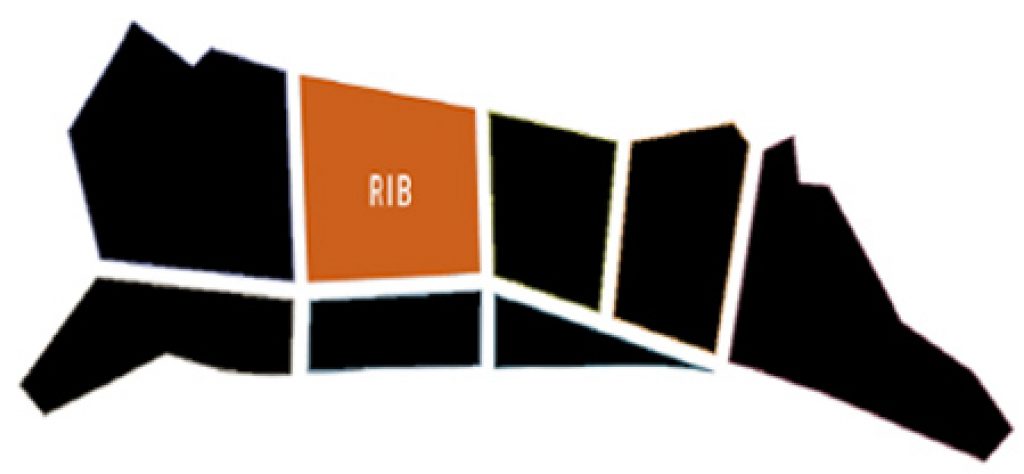
Ribs
Ribeye Light – Up
Ribeye Heavy – Up

Loins
Strip Loin – Steady
Top Sirloin – Steady
Tenderloins – Steady

Chucks & Rounds
Chuck
Roll – Steady
Clod Heart – Down
Clod Tender – Steady
Chuck Flap – Down
Top Inside Round – Up
Outside Round – Steady
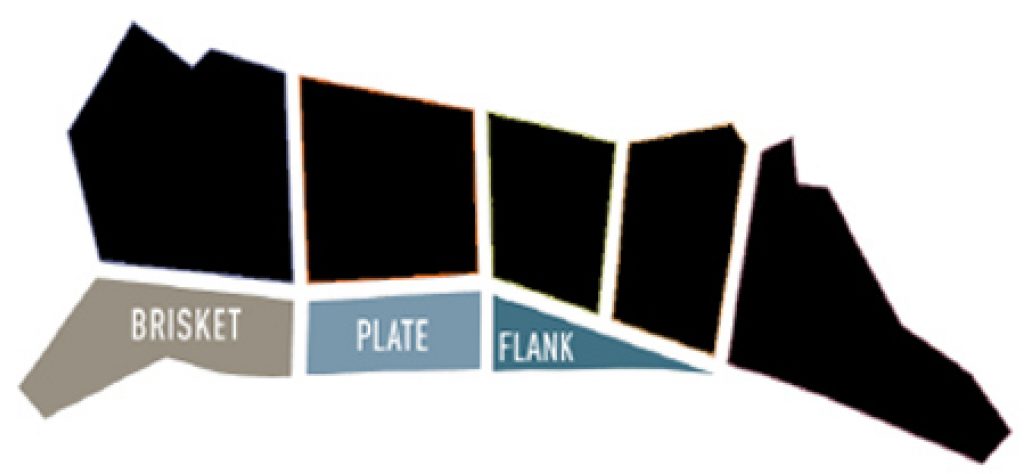
Thin Meats
Briskets – Up
Top Inside Round – Up
Outside Round – Steady
Flank Steak – Down
Outside Skirt – Up
Ground Beef
Ground Beef 73% – Up
Ground Beef 81% – Up
Ground Chuck – Up